Tracking Latest Benchmarks of dyGiLa
Along the course of development and deploy of dyGiLa, multiple stages of benchmark on computing clusters will be conducted. This page dedicates to track the benchmarks of dyGiLa on different hardwares and their scaling capabilities. Based on what kind and how many computing resources on hand, the statistics of benchmark data may change according to how many resources could be put on benchmark runs.
Strong Scaling Benchmark on Nvidia GH200 – 26th. Nov. 2025
With support from NVIDIA, the HILA’s development team gained access to four Grace–Hopper 200 (GH200) nodes on an internal NVIDIA cluster.
We conducted a small-scale yet significant strong-scaling benchmark using a 512^3 lattice on the available GH200 nodes with CUDA 13.0.0.
As shown in the plot below, dyGiLa demonstrates approximately 80% of ideal strong-scaling efficiency on the GH200 cluster.
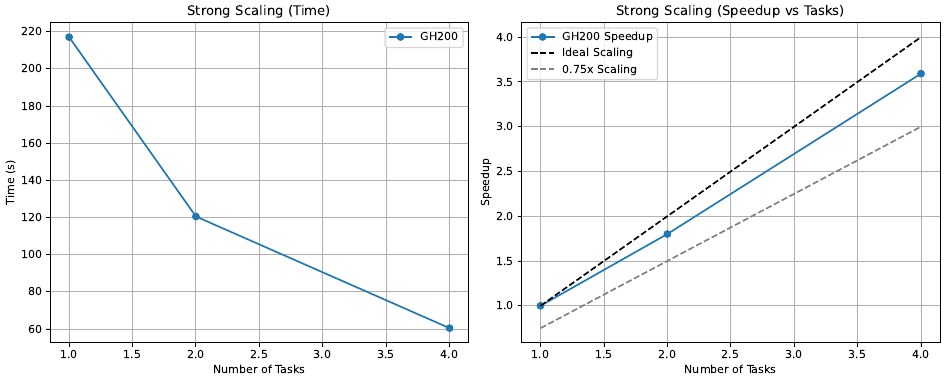
The benchmark was conducted using the NVIDIA HPC SDK (nvhpc 25.9) with CUDA 13.0.0, alongside UCX 1.19.0 built with GCC 13.3.0, and OpenMPI 5.0.8.
The workload was chosen from a representative dyGiLa production run and excludes heavy parallel I/O to focus on compute and communication performance.
Scalability Benchmark of dyGiLa on LUMI-G – 2. Mar. 2025
A comprehensive benchmark of the strong scaling and weak scaling capabilities of dyGiLa is done recently on LUMI-G
with LUMI/24.03 PE and ROCm/6.0.3.
Beside the scaling capabilities of dyGiLa’s main functionality, the insitu and HDF5 checkpoint is also benchmarked because outputting raw data
is a significant for conducting post-processing out of simulation.
As following plots show, perfect strong scaling is first impression,
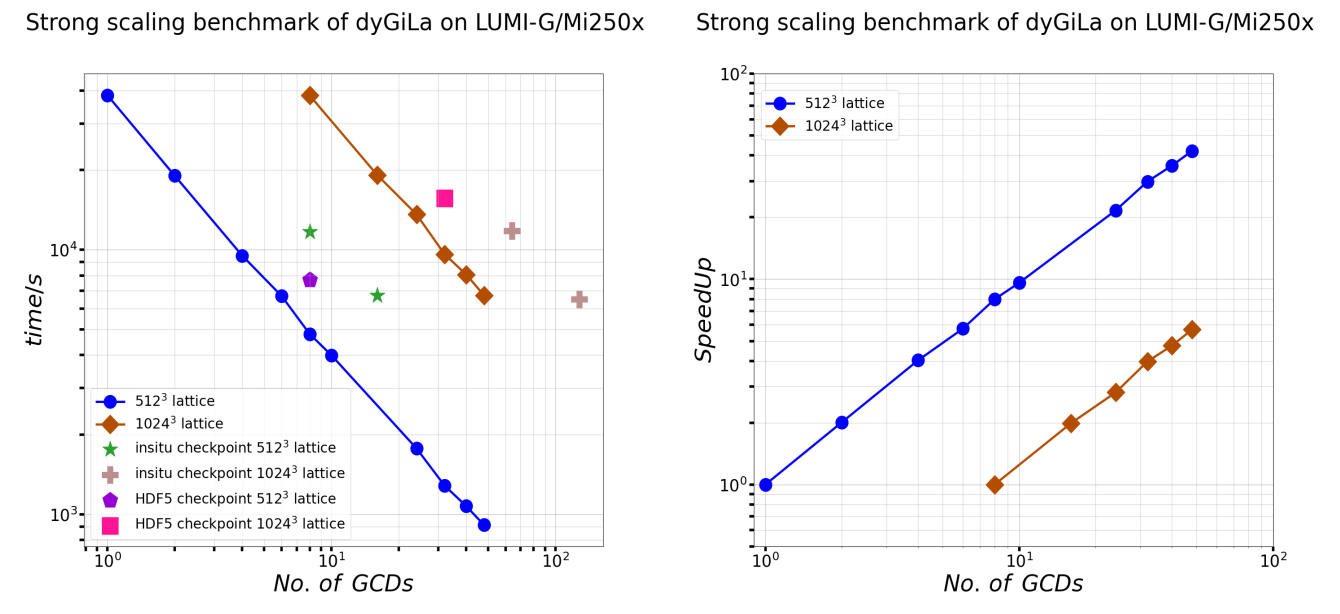
when lattice size is relatively small, SpeedUp nearly equals to the number of GCDs in used.
Notice the ìnsitu checkpoint does demonstrate strong scaling, see star markers and cross markers in left plot.
Moreover, HDF5 checkpoint is faster than ìnsitu checkpoint for the 512^3 lattice on 8 GCDs.
One could expect same behavior also happens for run with 32 GCDs.
Considering the IO intensity of task like checkpointing, it’s good that LUMI-G still can offer decent strong scaling on dyGiLa.
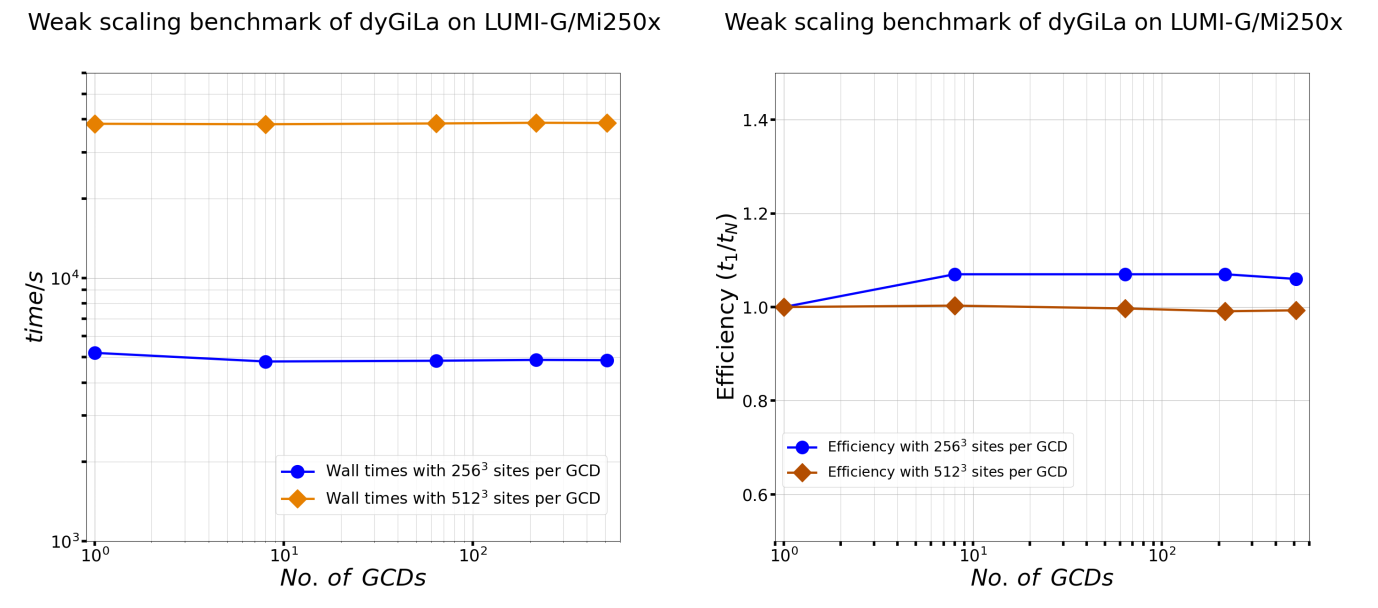
On the other hand, the weak scaling performance is also perfect, as shown in above plot.
The tested workloads per GCD are 256^3 and 512^3 sites respectively.
In all tests, weak scaling efficiency remains about 1.
The interesting observation here is runs with multiple GCDs finish slightly earlier than single GCD run when workload per GCD is 256^3 sites.
After increasing workload per GCD to 512^3, this phenomena became very much less visible.
Over all, dyGiLa does demonstrate perfect weak scaling.
Strong Scaling Benchmark on LUMI supercomputer – 30. Jan. 2025
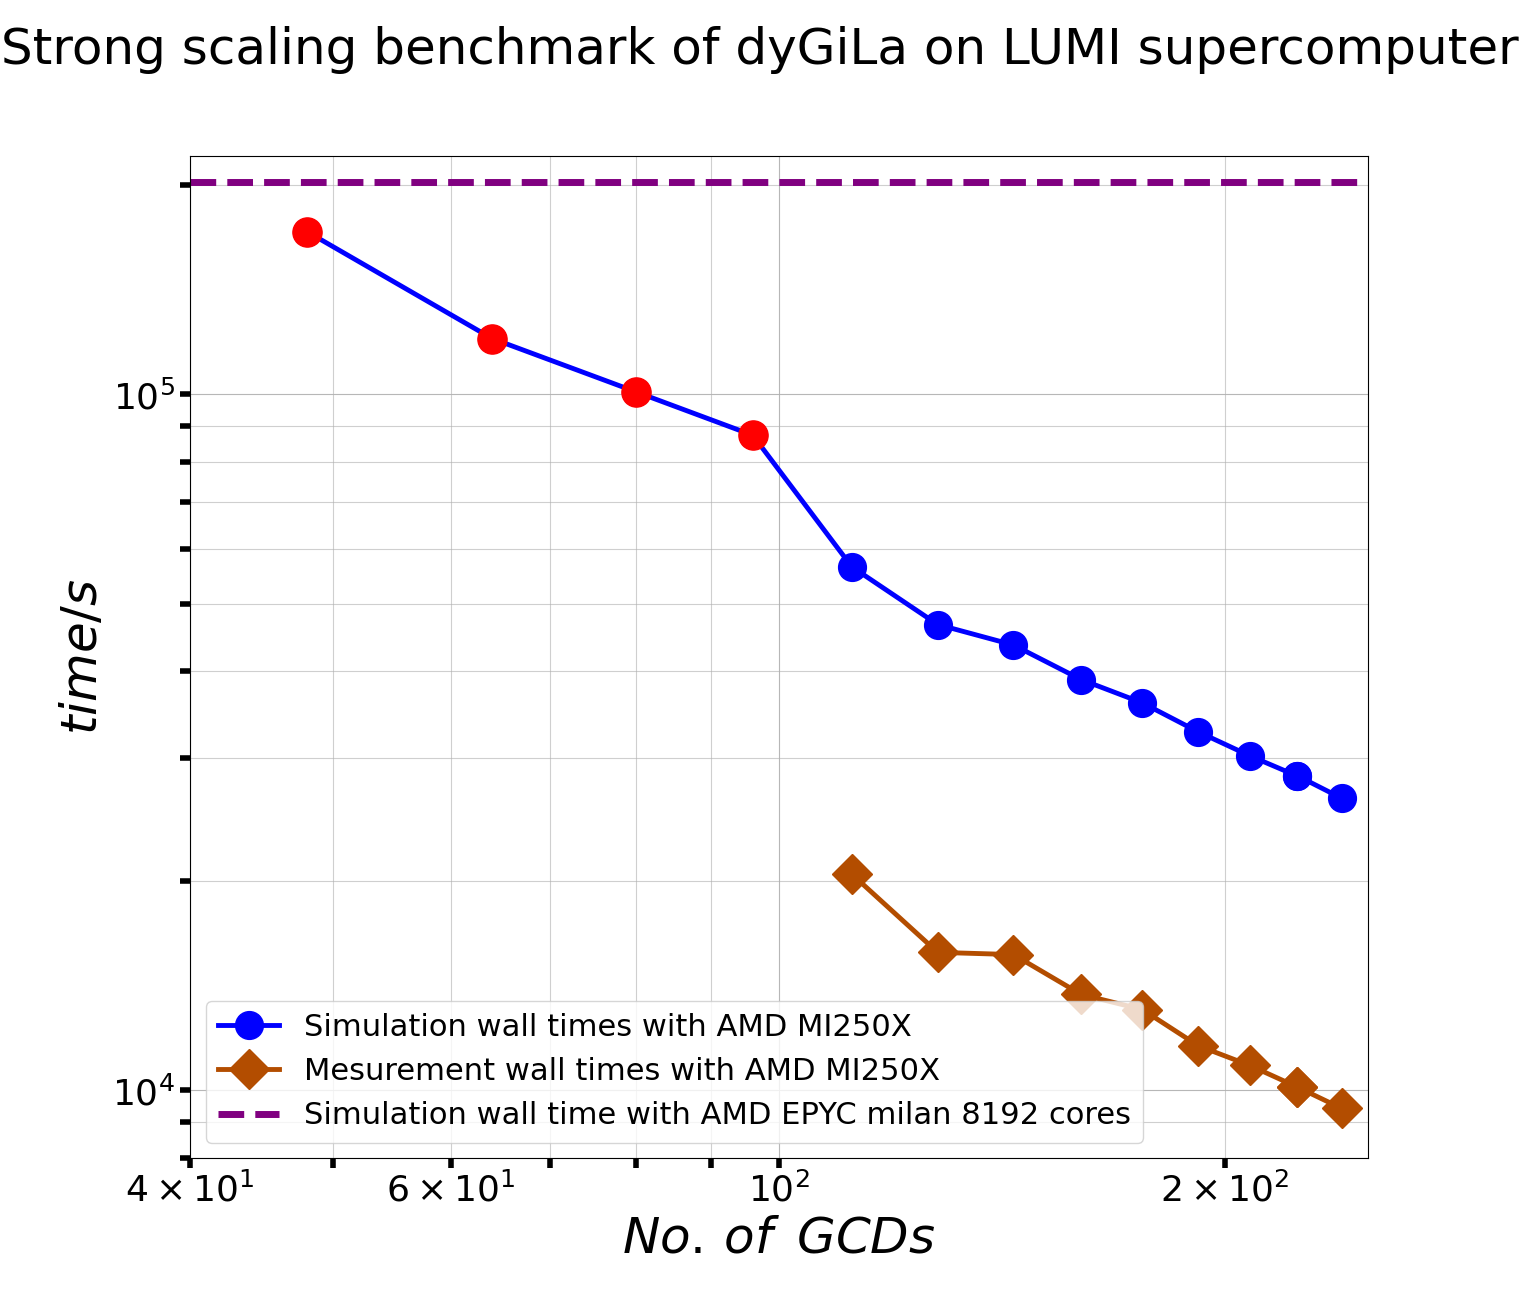
The following plot shows dyGiLa’s strong scaling characteristics on LUMI-G GPGPU partition.
the parallel data streaming engine pario was turned off in this benchmark.
the simulation domain has 2048*2048*2048 = 8.5899 billions sites on uniform lattice.
On each site, there are 18 + 18 + 1 + 3 + 1 = 41 float type numbers, which correspond to 2 complex valued matrix fields, 2 scalar filed and one vector field.
Then the total simulation data is 1.408749 Terabyte. This setup was run on LUMI-G with different number of nodes ranged form 6 to 30.
A LUMI-C run with 64 EPYC milan nodes is presented in same plot.
The programming environment (PE) LUMI/24.03 was used in this benchmark.
This PE provides Cray-spined Clang/17.0.1 compiler, gfx90a driver, ROCm/6.0.3 as well as fine tuned toolchain and building tools.
As to be the LUMI maintaining team suggested PE, it does give a perfect strong scaling as shown in cumulated times plot.
Here the cumulated time means Ǹo. of GCDs * wall time for GPUs runs, while 8192 * wall time for CPU run.
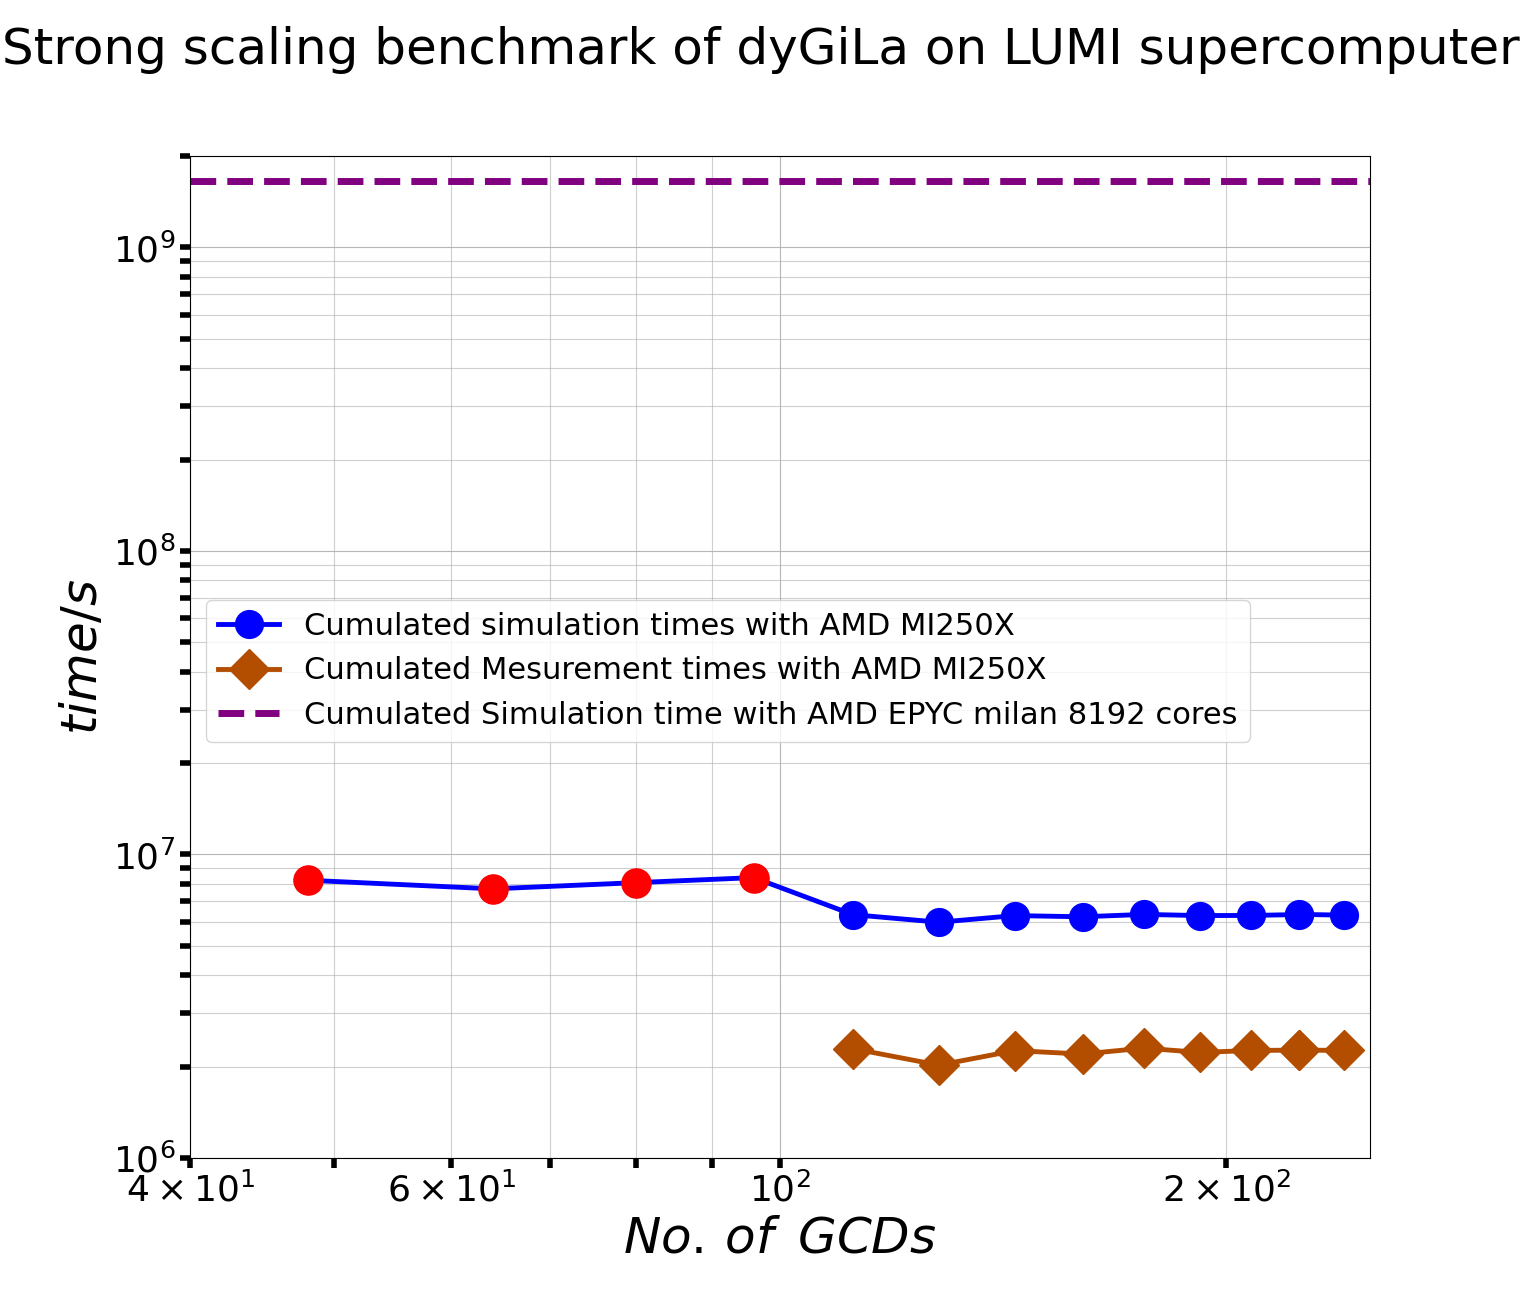
In both plots, x-axis stands for the number of Graphics Compute Dies (GCDs) in a run. AMD MI250x has two GCDs per card, then one LUMI-G node has eight GCDs. The blue dots and brown diamonds are simulation time data and measurement data respectively. They are raw data out of simulations. Because the numerical system, which was used for these benchmark runs, are very large, one could expect that the jobs will not be finished in a give time limit such as a day if the hardware resources provided to these runs are not enough. These runs are represented with red dots, of which the simulation time were calculated based on how many simulations have been done in log files. Besides this un-perfect, one still can conclude that dyGiLa does has perfect strong scaling feature by looking these plots.